One of the main metrics, which allows to estimate the performance of the existing or designed storage system is IOPS (Input/Output Operations Per Second). In simple terms, IOPS is the number of read/write operations with a storage, disk or a file system per a time unit. The larger is this number, the greater the performance of your storage (frankly speaking, the IOPS value has to be considered along with other storage performance characteristics, like latency, throughput, etc.).
In this post, I will look at several ways to measure the storage performance (IOPS, latency, throughput) in Windows (you can use this manual for a local hard drive, SSD, SMB network folder, CSV volume or LUN on SAN/iSCSI storage).
Capturing Storage I/O Using Disk Performance Counters in Windows
You can roughly estimate the current storage I/O workload in Windows using the built-in disk performance counters from Performance Monitor. To collect these counters data:
- Start the Perfmon;
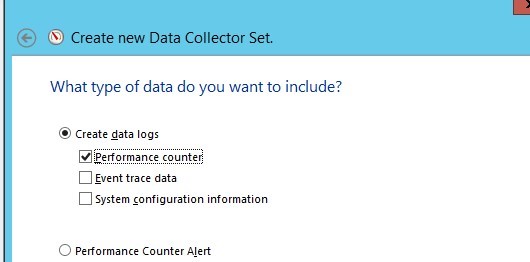
- Create a new Data Collector Set and select Create manually;
- Select the checkbox Create data logs -> Performance counter;
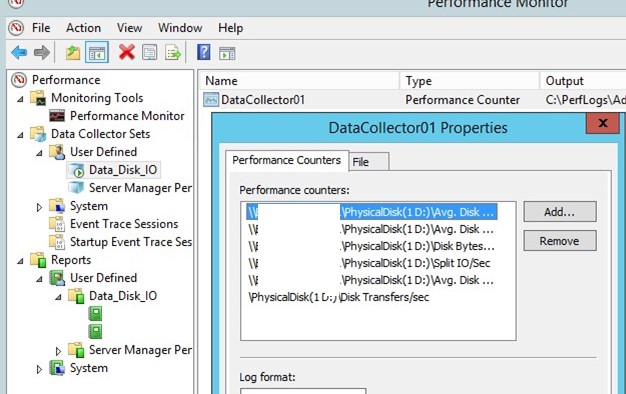
- Now in the properties of the new data collection set, add the following performance counters for the Physical Disk object (you can select the counters for a specific disk or for all available local disks):
- Avg. Disk Sec./Transfer
- Avg. Disk Queue Length
- Avg Disk Bytes/Transfer
- Disk Bytes/sec
- Disk Transfers/sec
- Split IO/sec
- You can change other data collection properties. By default, counter values are collected every 15 seconds. To display real time disk performance, you need to add the specified Perfmon counters in the Monitoring Tools -> Performance Monitor section.
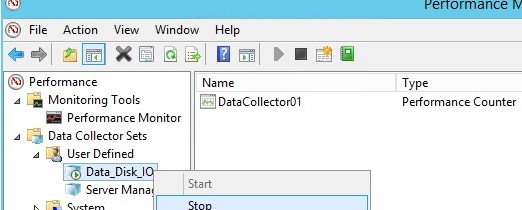
- It remains to start collecting performance counters data (select Start) and wait for the collection of sufficient information for analysis. After that, right click your data collector set and select Stop;
- To view the collected performance data go to the Perfmon -> Reports -> User Defined -> Data_Disk_IO —> check_the_last_set. By default, disk data is displayed as graphs;
- Use Ctrl + G to switch to the Report mode.
How to understand storage performance counters collected by Perfmon? For a quick analysis of the disk/storage performance, you need to look at the values of at least the following 5 counters. When analyzing the counter data, it is advisable for you to understand the current physical disks (storage) configuration (whether RAID or Stripe is used, the number and types of disks, cache size, etc.).
- Disk sec/Transfer – the time required to perform one write/read operation with the storage device or disk (disk latency). If the delay is more than 25 ms (0.25), then the disk array cannot handle the I/O operation on time. For high load servers, the disk latency value should not exceed 10 ms (0.1);
- Disk Transfers/sec – (IOPS). The number of read/write operations per second. This is the main indicator of the disk access intensity (approximate IOPS values for different disk types are listed at the end of the article);
- Disk Bytes/Sec – Total disk throughput (read+write) per second. Maximum values depend on the disk type (150-250 Mb/s – for a regular HDD disk and 500-10000 for SSD);
- Split IO/sec – a disk fragmentation indicator when the operating system has to split one I/O operation into multiple disk requests. It may also indicate that the application is requesting too large blocks of data that cannot be transferred in one operation;
- Avg. Disk Queue Length – average number of read/write requests that were queued. For a single disk, the queue length should not exceed 2. For a RAID array of 4 disks, the threshold value of disk queue length is 8.
DiskSpd: Testing Disk Performance and IOPS in Windows
Microsoft recommends to use the DiskSpd (https://aka.ms/diskspd) utility for generating a load on a disk (storage) system and measuring its performance. This is a command line interface tool that can perform I/O operations with the specified drive target in several threads. I quite often use DiskSpd to measure the storage performance and get the maximum available read/write speed and IOPS from the specific server (of course you can measure the performance of storage as well, in this case diskspd will be used to generate the storage load).
The DiskSpd does not require installation, just download and extract the archive to a local disk. For x64 bit systems, use the version of diskspd.exe from the amd64 directory.
I use the following command to test the performance of the disk:
diskspd.exe –c50G -d300 -r -w40 -t8 -o32 -b64K -Sh -L C:Tempdiskpsdtmp.dat > DiskSpeedResults.txt
Important. When using diskspd.exe, quite a considerable load is generated on the disks and CPU of the tested system. To eliminate the performance degradation for users, it is not recommended to start it on productive systems in peak hours.
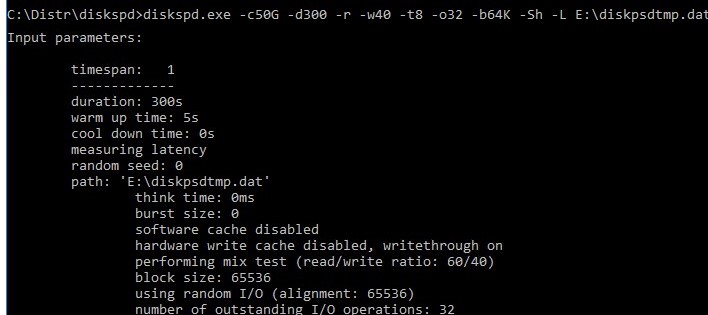
-c50G– file size 50 GB (it is better to use a large file size so that it does not fit in the cache of the storage controller);-d300– test duration in seconds;-r– random read/write operations (if you need to test sequential access, use –s);-t8– number of threads;-w40– ratio of write to read operations 40%/60%;-o32— queue length;-b64K— block size;-Sh— do not use cache;-L— measure latency;C:Tempdiskpsdtmp.dat– test file path.
After the stress test is completed, average storage performance values can be obtained from the output tables.
In my test, the following performance data (check the Total IO table) was obtained:
- MiB/s — 241 (about 252 Mb/s, not bad);
- IOPS — 3866 (perfectly well!);
- Average latency — 66.206 ms (quite a big latency!).
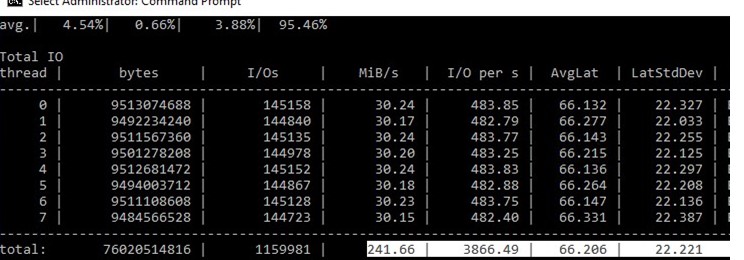
You can get individual values for read (section Read IO) or write (section Write IO) operations.
Having tested several disks or storage LUNs using diskspd, you can compare them or select an array with the desired performance for your tasks.
How to Measure Storage IOPS, Throughput and Latency Using PowerShell?
I have found a PowerShell script (by Mikael Nystrom, Microsoft MVP), which is essentially an add-on to SQLIO.exe utility (a set of file storage performance tests).
Note. In December, 2015, Microsoft announced the end of support for this tool and replacement of SQLIO with a more universal tool Diskspd, and removed SQLIO distribution files from its website. So you will have to search for sqlio.exe by yourself and download it.
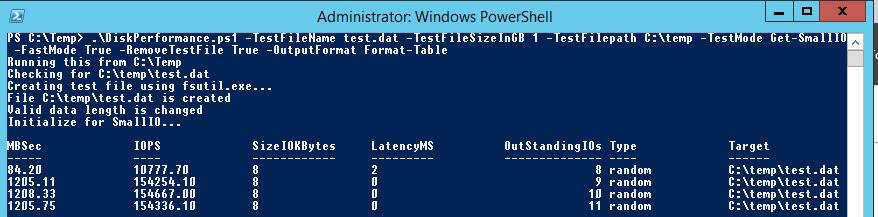
An example of running a PowerShell script to estimate disk performance and IOPS:
.DiskPerformance.ps1 -TestFileName test.dat –TestFileSizeInGB 1 -TestFilepath C:temp -TestMode Get-LargeIO -FastMode True -RemoveTestFile True -OutputFormat Out-GridView
Let’s review the script arguments:
–TestFileName test.dat– the name of the file created by FSUTIL tool;–TestFileSizeInGB 1– the test file size. Possible values are 1.5, 10, 50, 100, 500, 1,000 GB. The file size has to be larger than the size of the storage system cache. Otherwise, IOPS will be measured for the cache data, instead of the disk;-TestFilepath C:Temp– here you specify the disk to measure the performance for and the folder on the disk, in which a test file will be created. You can also specify an UNC path to the network shared folder (SMB);-TestMode Get-LargeIO– there are two options of input-output measurement. Get-SmallIO allows to measure IOPS, and Get-LargeIO measures data transfer rate. The difference between SmallIO and LargeIO arguments is in the block size of 8 KB and 512 KB while measuring the rate, and the type of access, Random or Sequential, correspondingly;-FastMode True– in the Fastmode, each test runs 10 seconds, otherwise it takes 60 seconds;-RemoveTestFile True– remove the test file after the test is over;-OutputFormat Out-GridView– the test results can be displayed either in PowerShell console (Format-Table) or in a separate graphic chart window (Out-Gridview).
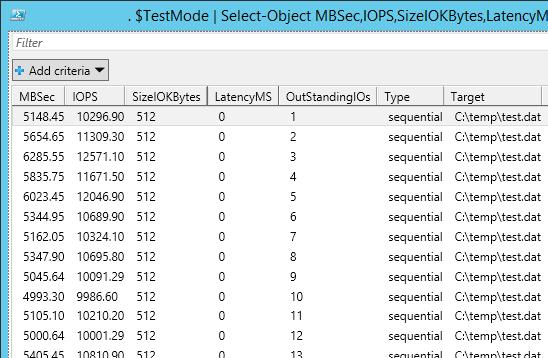
In our case (a vmdk virtual disk on the VMFS datastore on HP MSA 2040 connected over SAN is used) the disk array showed the average IOPS value of about 15,000 and the data transmission rate (throughput) about 5 Gbit/s.
In the following table, the approximate IOPS values for different disk types are shown:
| Type | IOPS |
| SSD(SLC) | 6000 |
| SSD(MLC) | 1000 |
| 15K RPM | 175-200 |
| 10K RPM | 125-150 |
| 7.2K RPM | 50-75 |
| Raid5 of 6 drives with 10K RPM | 1000 |
Below are some recommendations for disk performance in IOPS for some popular Microsoft services:
- Microsoft Exchange 2010 with 5,000 users, each of them receives 75 and sends 30 emails per day, will require at least 3,750 IOPS;
- Microsoft SQL 2008 Server with 3,500 SQL transactions per second (TPS) requires 28,000 IOPS;
- A common Windows application server for 10-100 users requires 10-40 IOPS.